Data Analysis · Los Angeles County

Not All Neighborhoods Are Created Equal: Crime & Safety Across LA County

A data-driven look at how crime rates vary dramatically across ten cities in the greater Los Angeles area — and what the patterns reveal about economic inequality, policing, and urban safety.


Central Argument: Crime in Los Angeles County is not evenly distributed — it is deeply shaped by socioeconomic conditions. Cities like Compton, Inglewood, and South Gate face total crime burdens more than three times higher than wealthier enclaves like Irvine and La Cañada. Strikingly, Theft dominates every city's crime profile, suggesting that economic precarity — not inherent danger — drives the majority of criminal activity across the region.

Los Angeles County Crime Rates by City

The dataset below captures reported crime rates per 100,000 residents across ten distinct cities in LA County, spanning seven crime categories: Assault, Murder, Rape, Robbery, Burglary, Theft, and Motor Vehicle Theft.

Crime Type Burbank Pasadena Irvine La Cañada Glendale Inglewood Anaheim Compton Downey South Gate
Assault 282.1 326.6 47.0 35.0 173.2 358.0 437.2 863.1 255.6 251.1
Murder 2.0 0.8 1.6 0.0 2.2 6.9 3.6 20.1 0.9 4.5
Rape 11.0 33.3 13.3 15.0 18.5 45.4 50.2 38.0 28.7 29.1
Robbery 8.0 119.7 22.1 20.0 93.4 264.3 105.2 350.6 154.7 241.0
Burglary 94.7 557.0 197.9 360.3 202.0 296.9 348.0 387.4 294.5 288.0
Theft 2,436.5 1,864.9 1,122.0 850.8 1,594.6 2,451.7 1,432.8 1,611.1 1,490.2 2,335.7
Motor Vehicle Theft 293.0 275.1 70.0 100.1 230.2 865.9 351.3 1,146.7 1,101.2 975.1

↑ Figures are crime incidents per 100,000 residents. Red values indicate notably high figures within each category.

Three Numbers That Tell the Story

10×
Assault Rate Gap

Compton's assault rate (863.1) is nearly ten times higher than La Cañada's (35.0) and Irvine's (47.0), revealing the starkest divide in violent crime across these cities.

~75%
Theft Share of All Crime

In nearly every city, Theft alone constitutes roughly 70–80% of total reported crimes. This makes it the single most critical category — and largely a property crime tied to economic need.

4,438
Compton's Total Crime Rate

Compton has the highest aggregate crime rate across all seven categories — more than 3× the total burden of Irvine (1,474) and La Cañada (1,381).

Three Charts, One Argument

Each chart below reveals a different dimension of the same underlying pattern: crime in LA County follows socioeconomic fault lines.

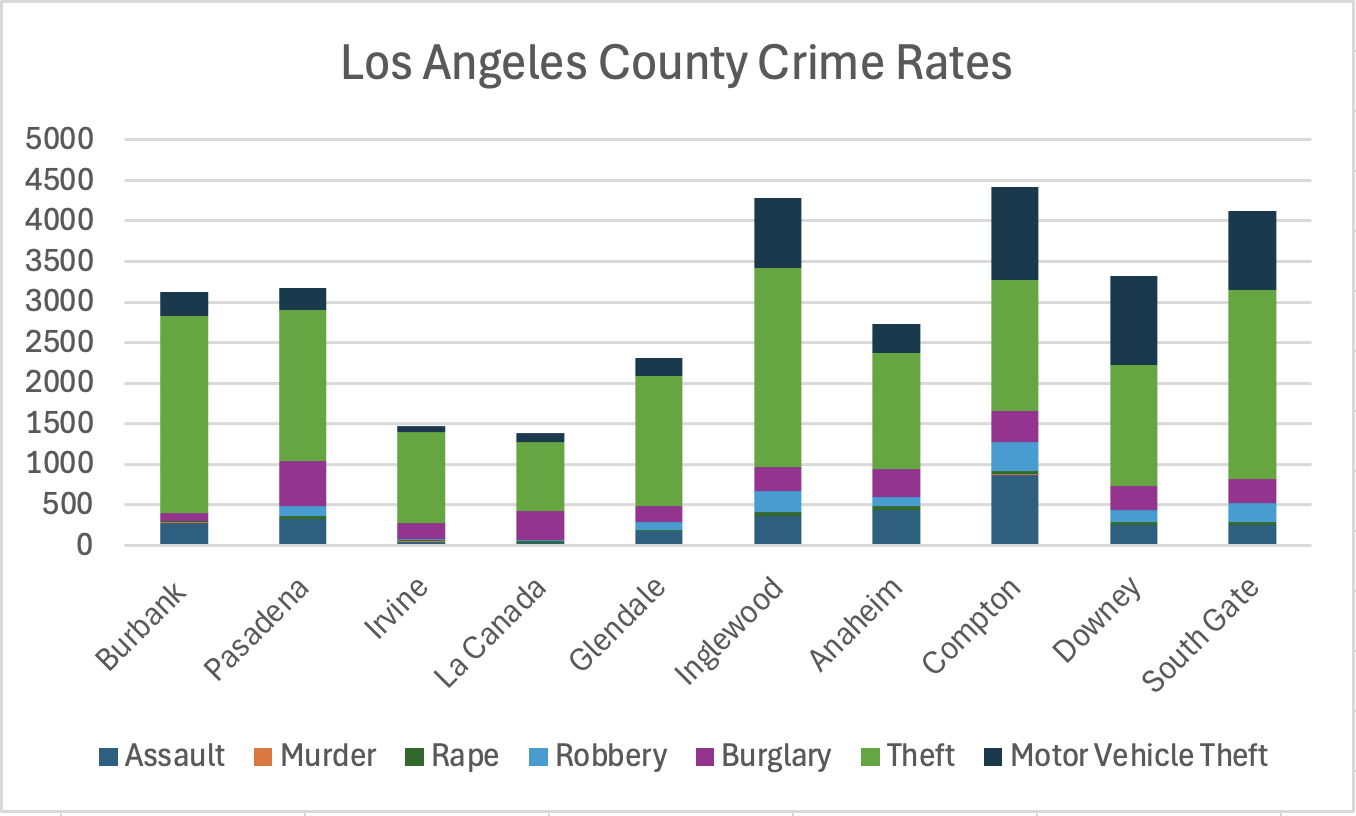
Chart 01 — Stacked Bar (Vertical)

Total Crime Burden by City

A stacked bar chart showing the cumulative crime rate per city, broken down by crime type. Cities are grouped along the x-axis for side-by-side comparison of their overall crime load.

Stacked vertical bar chart: Los Angeles County Crime Rates by city
Analysis: This chart makes the overall burden immediately legible. Compton and Inglewood tower over the others — yet even "safer" cities like Burbank and Pasadena carry substantial total crime loads driven almost entirely by Theft (green). The near-uniformity of the green segment across all bars is the chart's most important story: property theft is a countywide condition, not a neighborhood pathology.

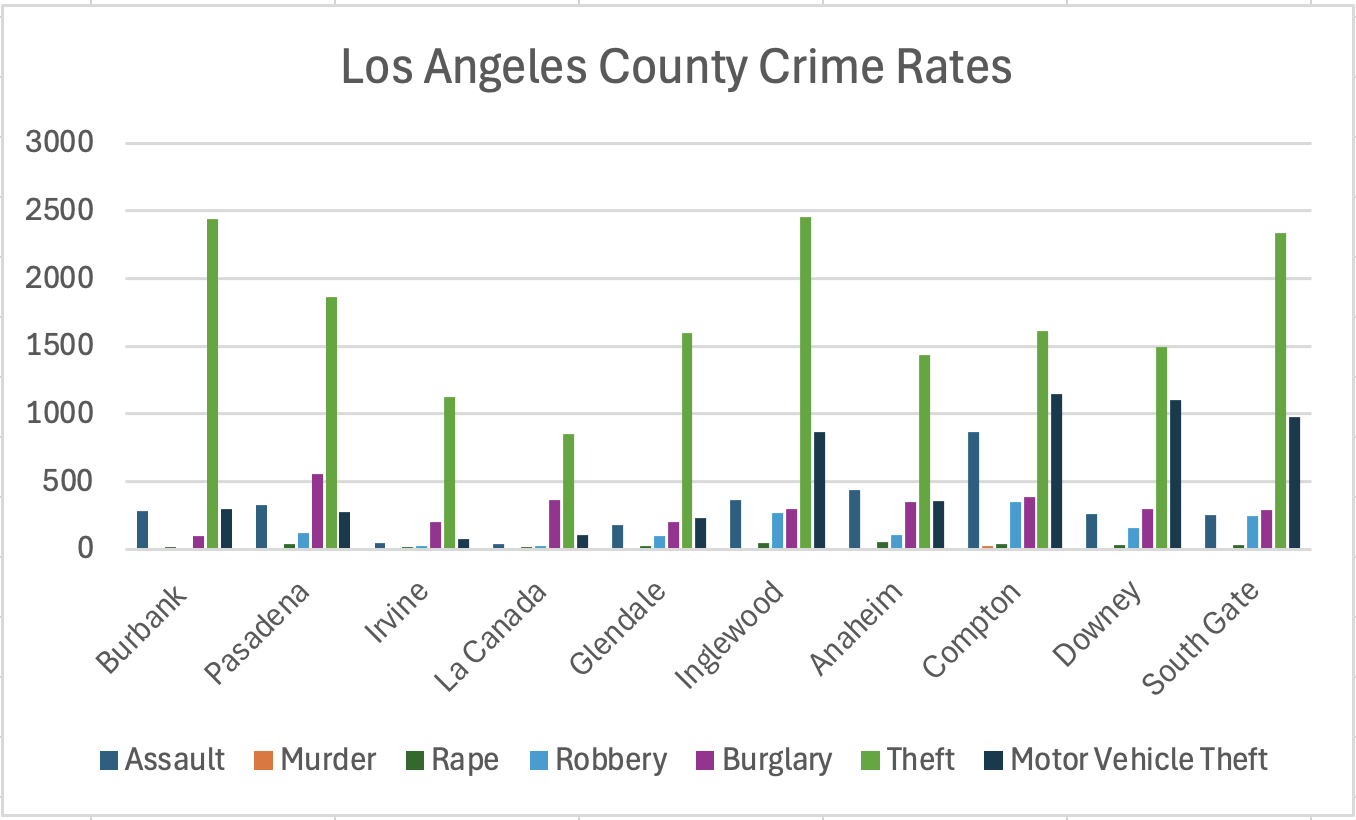
Chart 02 — Stacked Bar (Horizontal)

City-by-City Crime Composition

A horizontal stacked bar chart showing the same data, allowing easier reading of city names and highlighting proportional differences in crime category mix across all ten cities.

Horizontal stacked bar chart: Los Angeles County Crime Rates by city
Analysis: Viewing the data horizontally makes the composition of crime clearer. Notice how Compton and Inglewood not only extend further right — but their bars also show much more visible segments of dark blue (Assault) and dark teal (Motor Vehicle Theft) compared to cities like La Cañada and Irvine, where the bar is almost entirely Theft and Burglary. This shift from property crime toward violent crime marks the sharpest divide between wealthy and lower-income cities.

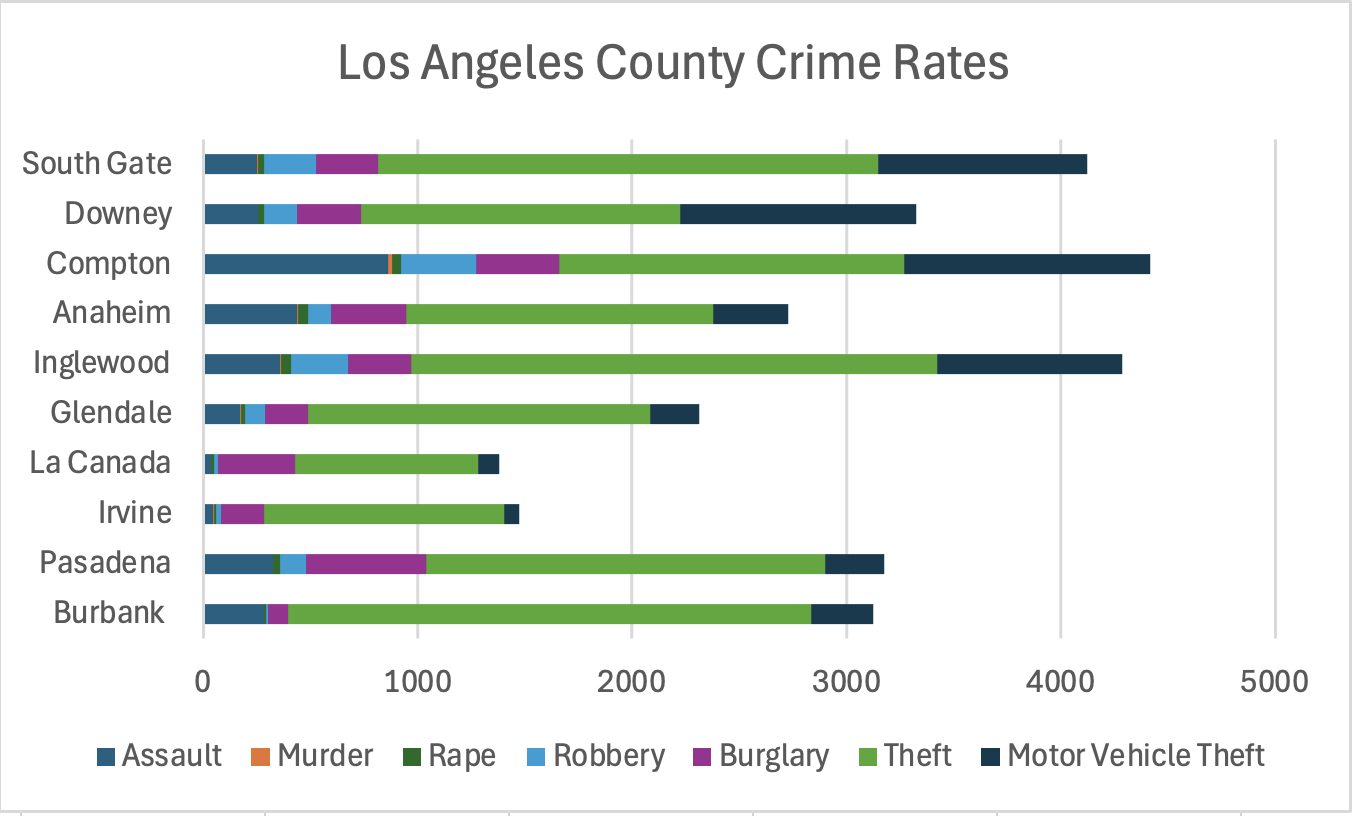
Chart 03 — Grouped Bar

Category-Level Comparison Across Cities

A grouped (clustered) bar chart separating each crime type side by side within each city, enabling direct comparison of individual crime categories across all ten cities simultaneously.

Grouped bar chart: Los Angeles County Crime Rates by city and category
Analysis: With categories ungrouped, the green Theft bars surge to the top in nearly every city — confirming its dominance. But this chart also isolates crucial nuances: Compton's dark blue Assault bar dwarfs every other city's, and its Motor Vehicle Theft (black) rivals or exceeds its Theft rate in a way no other city does. Meanwhile, Irvine and La Cañada show relatively flat, even bars — a sign of lower crime uniformly distributed across categories rather than any single crime type dominating.

What the Data Tells Us — and What It Doesn't

Across all three charts, a consistent picture emerges: geography predicts crime in Los Angeles County more than any other single factor. Cities with lower median incomes and higher population densities — Compton, Inglewood, South Gate — carry dramatically heavier crime burdens than their wealthier counterparts.

Theft is the great equalizer: it appears at high rates in almost every city, including affluent ones like Burbank and La Cañada. This suggests theft is less a sign of social breakdown and more a rational response to economic pressure and opportunity — present everywhere, but especially acute where economic inequality is most severe.

Violent crime — assault, murder, and robbery — tells a starker story. These categories spike significantly in lower-income cities, pointing to systemic stressors that go far beyond individual behavior: poverty, under-resourced schools, unemployment, and limited social services.

These numbers are reported crimes per capita, which means they are also shaped by policing intensity, reporting rates, and community trust in law enforcement — all of which vary by neighborhood. The data is a window into inequality, but not the whole picture. Where you live in LA County still determines your safety in ways that have little to do with your choices.